Back in the day, MacOS came bundled with a muy cool app called Graphing Calculator developed by tiny software house Pacific Tech (nerd points for recognizing the reference). You typed in an equation and GC would plot it. Huzzah, yes, but mere words fail to capture the GC experience. There were 2D plots and 3D plots, real plots and complex plots, explicit equations and implicit equations, derivatives and integrals, infinite series, parametric curves, polar coordinates, vector fields, contour maps, animations, annotations, trig functions, hyperbolic functions, Bessel functions, gamma functions, airy functions, spherical harmonics, lions and tigers and bears. If you could think it, CG would plot it or brick your machine in the attempt.
When MacOS became OS-X, Graphing Calculator became Grapher. Or so I thought. I always assumed Grapher was Graphing Calculator with a Quartz paint job and a new name, the latter presumably to evade TI litigation. However, the Interwebs insist Grapher is a different animal, developed by a different company, even though the UX is nigh identical to GC. I guess there's only so many ways to implement the "type stuff and plot it" paradigm.
Also like GC, Grapher comes with many built-in examples -- indeed many of the same examples GC did if I recall. However, there's some important exceptions. Missing is the famous GC pac-man, presumably omitted to evade Namco litigation. And the GC 4D examples are missing, presumably omitted to evade blowing your mind.
Of course, also missing is the Mandelbrot set.
Which brings us to today's post.
The Mandelbrot set wins a LabKitty lifetime award for most largest impressive-to-difficulty ratio. You can explain how to make one in a couple of lines (ratio denominator small). Yet, its discovery literally created a new field of mathematics (ratio numerator big). Imagine Benoit Mandelbrot laboring in some dusty IBM backroom in the late 70s, the first crude pictures of his eponymous set peeling off a state of the art dot matrix printer. At that time, complex numbers had been a thing since about the 1600s. And after? Fractals, chaos, attractors, a New Kind of Science. The Mandelbrot set burst open a new reality. Yet it had sat there waiting to be discovered for some 300 years. You could have discovered it. Heck, I could have discovered it. Maybe we wouldn't have understood its significance, but generating a Mandelbrot set is absurdly easy.
Footnote: At the other end of the impressive-to-difficulty ratio scale we find the integral of the Gaussian distribution. Which requires that 2D polar conversion dealio or some other mutant trick. And all you get in return for this agony is 1. But I digress.
Now that you see the words "plot the Mandelbrot set in Grapher," you are thinking about plotting the Mandelbrot set in Grapher. But you are also sad, for, as covered earlier, Grapher does not come with a Mandelbrot example.
What to do?
Prodigious Googling on my part failed to uncover a solution, but maybe I'm not using the right search terms. No matter. Let's see if we can't figure it out on our own.
First, a little background.
As promised, one can explain the Mandelbrot idea in a few lines. Picture the complex plane. Break it up into a grid (the finer the grid, the better-looking the result). Call the center of a given grid square "c" -- that is, c = x + iy where (x+iy) is the center of the grid square under consideration. Set z = 0, then iterate z = z^2 + c. Formally, you must iterate forever, but we'll get around that in a moment. If the value (i.e., modulus) of z stays finite during the iteration color that grid square black (or blue or whatever). That location is in the Mandelbrot set. If z "blows up," that point is not in the set. Ergo, don't color in that grid square.
Repeat for all grid squares. Viola! Mandelbrot set.
That's it. If you've never seen the algorithm details before, they probably seem like a lie. Surely it must be more complicated, no? I assure you, madam, it is not. However, there's a few tricks that make life simpler. The most useful of these is we don't have to iterate z = z^2 + c forever. You can show with math that if the magnitude of z ever gets larger than two (i.e, |z| > 2 aka z*z > 2, where z* is the complex conjugate of z) the jig is up. That point is not in the set.
Alas, even using a cutoff of two, you can never be sure that you iterated enough times. A slow growing point may still give |z| < 2 on the million-th iteration but not on the billion-th. There's not much we can do about that -- we can only do so many iterations -- but it turns out this is not the end of the world. What we'll discover is finite iteration simply reduces the resolution of the plot. More later.
The present challenge is translating all this blah-blah into Grapher. Grapher isn't a programming language, so we don't have loops or if statements or much of anything, really. So we must find some crafty way to implement the iteration. (Full disclosure: I remembered this trick from the Graphing Calculator example, although I couldn't remember anything else. Indeed, I had to bang on Grapher for a few nights before I got it to work.)
Let's start simple and sneak up on the final result. Baby steps. Our first task is understanding how to make a density plot.
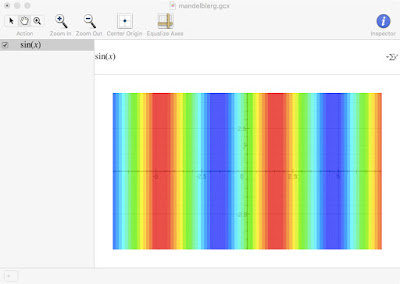
Usually in Grapher, you type y = blerg(x), where blerg is the function you want to plot. For example, y = sin(x). However, we want Grapher to make a density plot -- a color contour plot of the y(x) viewed from above. To do that we just leave off the "y =" part. For example:
Stare at this until you grok what you are looking at (hint: the reds are the peaks and the greens are the troughs).
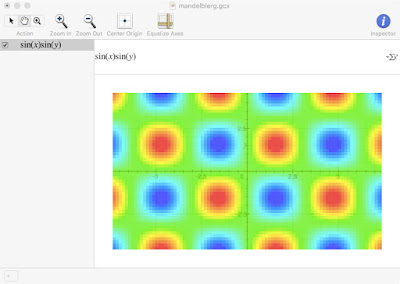
We can also made a density plot using an expression that varies in both x and y:
Again, stare and grok.
We're going to use a density plot to make a Mandelbrot set.
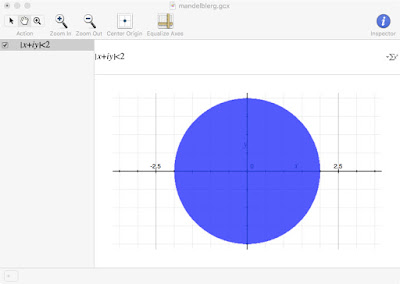
First, we need to get comfortable with complex numbers in Grapher. The app understands x+iy means the plane is the complex plane and it understands | blerg | means the magnitude of blerg (if blerg is complex; otherwise | blerg | is just ordinary absolute value). So we can plot something like this:
The result is a disc in the complex plane -- all numbers x+iy having magnitude less than 2. Progress!
Footnote: If your disc isn't round, try the Equalize Axes button.
This is a good time to introduce the Inspector tool. Select your equation |x+iy| < 2, then click on the "Inspector" button in the upper right corner of the plot window. This will bring up a dialog box that lets you adjust the plot opacity and resolution. Try it out. Important quirk: You must click the round arrow to the right of the resolution button after you change the plot resolution for the new resolution to take effect (and you must click exactly on the head of the damn arrow for the click to register).
Footnote I set the resoultion to maximum for all of the screen captures. Also, I used 80% opacity in the first few plots, but changed to 100% for the Mandelbrot plots.
Next, we need to get z^2 + c into the mix. For this we turn to Grapher's use of equation definitions -- that is, we can define an equation that another equation can use.
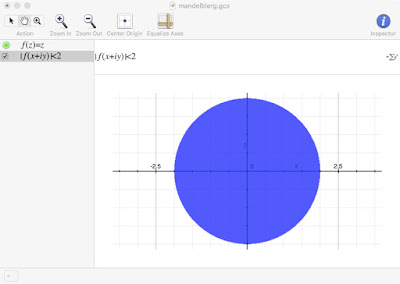
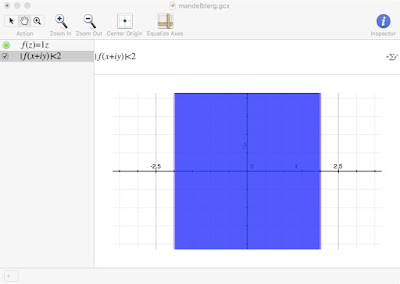
We again move in baby steps. Select New Equation from the menu, type in f(z) = z, then change the equation defined in the last step from |x+iy| < 2 to |f(x+iy)| < 2:
You should see the same plot as before. Addition of f(z) = z has changed nothing. This may seem silly, but we've verified our equation definition is Working as Advertised. The equation f(z) = z is just a placeholder -- it returns the value you send it. We changed the first equation to use f(z) in order to test it. The fact that we get the same results indicates all is well.
Footnote: Grapher can be pesky about what it will and won't allow in equation definitions. If it ever gives you a yellow warning sign rather than a green equals when you define a function, make sure you're not using any of the Grapher reserved symbols. See "Show Built-in Definitions" under the help menu for a list of reserved symbols.
We're going to use f(z) to implement iteration. The magic is we're allowed to pass anything to f, including an expression containing f. For example, if we write f(f(z)), the "outer" f takes as input the output of the "inner" f. That gives us one Mandeliteration. We then just need to do sufficiently many iterations and check the magnitude of the result against 2. Easy peasy.
However, we need to get around an annoying Grapher bug.
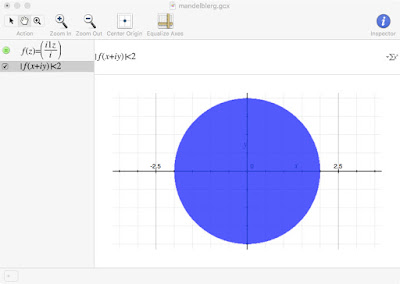
If we change f(z) = z in the previous example to f(z) = 1z, hopefully you would agree the plot shouldn't change. We just multiplied by 1. Redonkulous perhaps, but perfectly legal.
However, something wonky happens to our plot:
That there ain't right. It looks like normal absolute value. Grapher appears to be ignoring the imaginary part of the calculation. Or something.
Fortunately, there's an easy workaround. We can force Grapher to stay in complex mode if we multiply and divide by i:
Now the plot is correct.
Footnote: Sometimes I have to type the equation twice or delete and reenter it or use i1z/i instead of 1iz/i to get the trick to work. Stay frosty.
We'll use this trick moving forward because the bug also happens in expressions involving z^2. The workaround isn't horrible, although it does make our equations look cluttered. Tut mir leid.
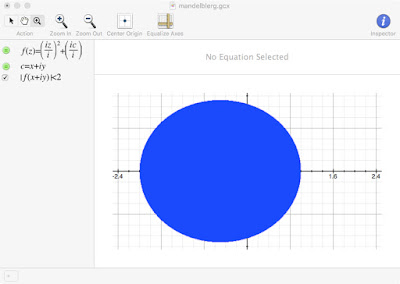
We are now ready for Mandelfun. All we need do is change f(z) = z to f(z) = z^2 + c. In this expression, z is a place holder. It gets us from one iteration to the next. But c is fixed. It's x+iy (the center of the grid location). As such, we need a second defined function to implement it. This function simply returns x + iy. Heck, we can even call the function c.
Add the equation c = x+iy, then include c in your definition of f (be sure to multiply and divide by i). The result should look like this:
This doesn't much look like a Mandelbrot set yet, but now comes the boom.
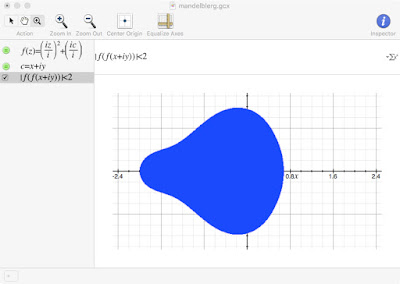
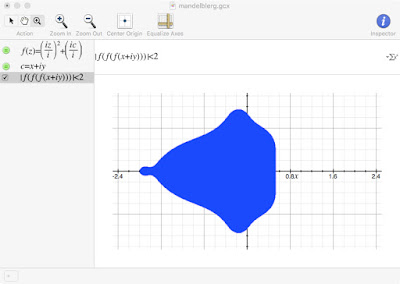
We iterate f(z) by nesting calls to f. Here's the result of one iteration:
Increase to two iterations:
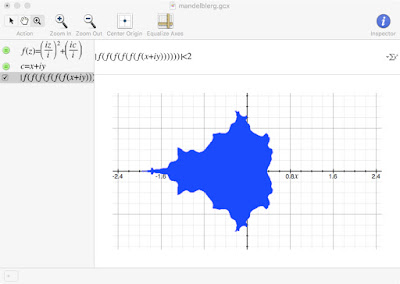
Skipping ahead to five:
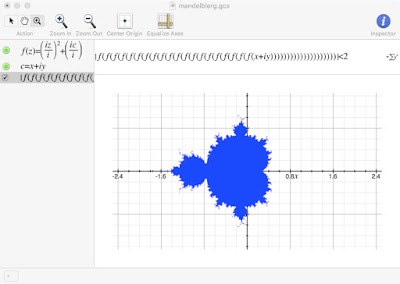
Now it's just a question of upping the iterations. Imma just jump ahead to the final result, in which I used 20 iterations:
Viola! Mandelbrot set.
I included the interim results of one, two, and five iterations to demonstrate the connection between iterations and resolution. Note that the interim results aren't really wrong, they're just wrong-ish. (I call them Mandel-not sets. Wordplay!) They include too many points. As we add iterations, more points get rightly excluded and the boundary converges to the true boundary. But the excluded points are always correct. As such, low iteration is equivalent to low resolution. Indeed, you'll often see lower iteration results plotted in the background of professional images of the Mandelbrot set, like serving Kep-mok blood ticks on a delightful bed of spring greens.
Warning: If you are like me, and why wouldn't you be, you are tempted to see how far you can push the iteration envelope. That's easy to do: just keep cutting and pasting more and more nested evaluations of f(x+iy). However, this is dangerous. Not only will the computation time get excessive, Grapher might eventually crash your machine. I only got up to around 25 nested evaluations before Grapher bricked and I had to restart my laptop. Consider yourself warned.
Postscript
So there it is. The Mandelbrot set in Grapher. You can do the standard Mandelbrot things like zoom in and look for self-similar structures and so on. However, Grapher is rather sluggish, which spoils much of the fun. There's other wonders as well; my favorite is that the escape numbers for points along a vertical line close to the left edge of the main cardioid form the digits of π. See my old pi-day post for the rest of that bizarre story.
In the end, I can't help but think this is the sort of thing you might stumble upon if you screwed around with Grapher long enough on your own. Say, if you we're stuck at home for months with nothing to do because of some global pandemic. Like Newton and calculus. You're innocently exploring the nooks and crannies of Grapher. Suddenly: A wild Mandelbrot appears.
Would you realize what you had stumbled upon (i.e., assuming Mandelbrot had not already discovered the thing)? I probably wouldn't, although I might print it on a shirt and sell it on Zazzle. Eventually mathozoids dressed in their quality LabKitty set shirts would swoop in with their connectedness theorems and their period doubling and their hyperbolic components and their Yoccoz parapuzzles and a proof that the LabKitty set contains points with escape numbers that generate a representation of π and many things besides, for that is what mathozoids do.
And yet, the Mandelbrot set just sat there. For hundreds of years. Waiting to be discovered.
What else might be?



no need to put brackets. you write : fffffff(x+iy) !
ReplyDelete